Ever wonder why ARRI lenses look so good? Learn how MTF testing unlocks their cinematic sharpness, contrast, and legendary optical performance. Read this simplified guide!
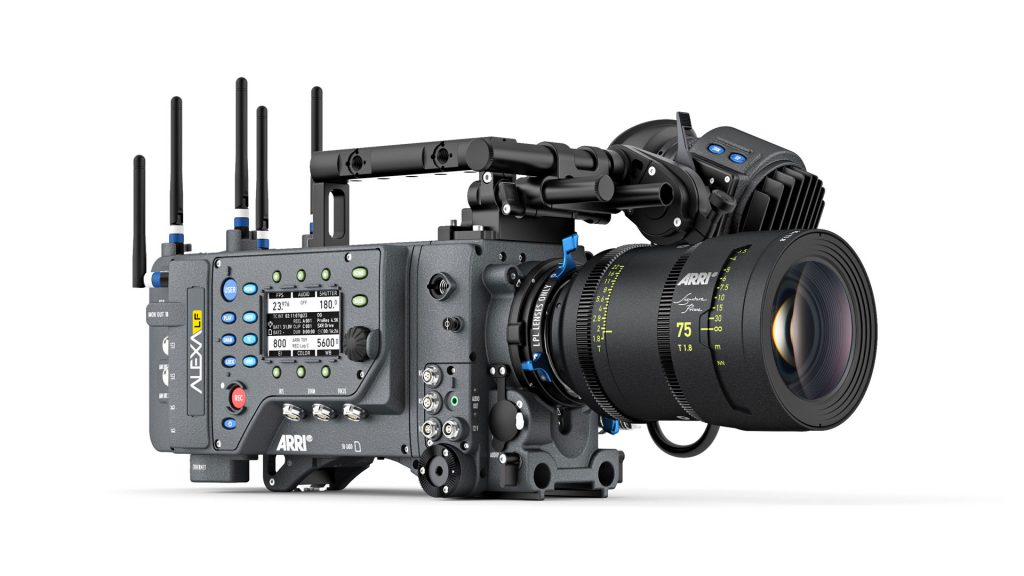
What exactly is that “ARRI look”? It’s often described as a combination of natural skin tones, deep blacks, excellent shadow detail, and, crucially, remarkable sharpness. But how do we define that sharpness objectively? It’s not just about resolving tiny details; it’s also about maintaining contrast across the entire image frame.
This is where MTF testing comes in. Understanding MTF (Modulation Transfer Function) is the key to demystifying optical performance and appreciating the incredible engineering that goes into every ARRI lens.
MTF testing isn’t just about measuring how small a detail the lens can resolve. It’s about measuring how well it maintains contrast as details get progressively finer. This provides a far more complete picture of actual perceived image quality.
What is MTF Testing and How Does it Work?
MTF, which stands for Modulation Transfer Function, is a mathematical assessment that quantifies how accurately a lens transfers contrast from the object to the image.
Here’s how it’s commonly done:
- The Test Target: Engineers use a test chart featuring alternating black and white patterns. These patterns have different “spatial frequencies,” measured in line pairs per millimeter (lp/mm). A line pair is one black line and one white line. Low frequencies have thicker, wider-spaced lines, representing coarse, broad details. High frequencies have thinner, tightly packed lines, representing fine, intricate details.
- Projecting and Capturing: The lens projects an image of this chart onto a specialized sensor or is evaluated on a precise optical bench.
- Calculating Modulation (Contrast Transfer): The test equipment measures the luminance values (brightness) of the black and white lines in the projected image. It compares this resulting image contrast to the theoretical 100% contrast of the target. This calculation is called the “modulation.”
- A modulation of 1.0 (or 100%) means the lens transferred contrast perfectly, perfectly separating the black and white lines.
- A modulation of 0.5 (or 50%) means the contrast was significantly reduced.
- A modulation of 0.0 means the black and white lines have blended into a uniform gray, and no contrast or detail is resolved.
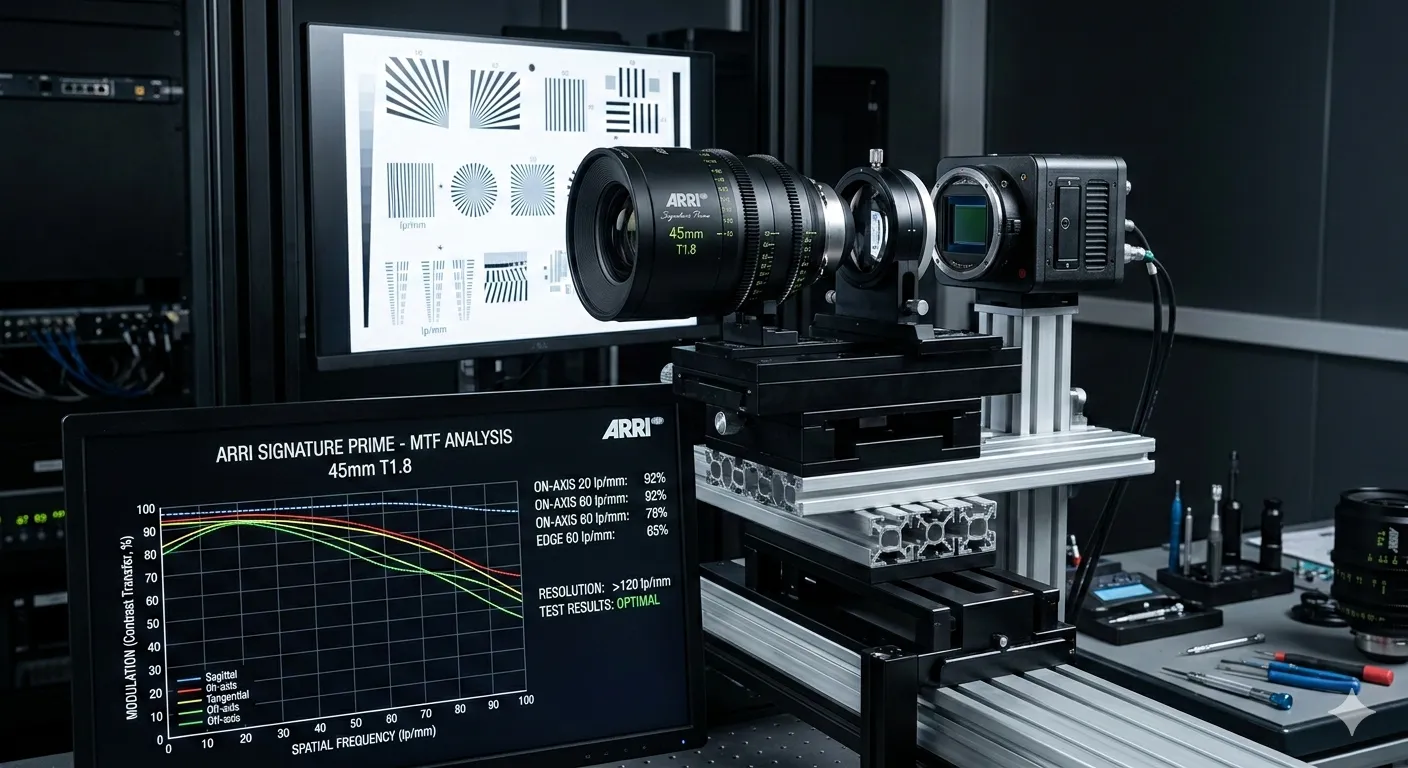
The final output is an MTF Curve, a graph that plots modulation (Y-axis, from 0 to 1.0) against spatial frequency (X-axis, from 0 to 80+ lp/mm, sometimes much higher for cinema lenses).
Why MTF Data is Your Lens’s Fingerprint
The MTF curve provides a detailed visual representation of how a lens handles different levels of detail.
- The Shape Matters: A high-quality lens like an ARRI will have an MTF curve that starts high (close to 1.0) for low spatial frequencies and remains relatively flat for as long as possible before gradually dropping off. A lens with poor contrast will have a curve that drops steeply right from the beginning.
- Where It Drops Matters: The point at which the curve drops below a significant value (e.g., 0.5 or 0.2) indicates the lens’s “resolution limit.” ARRI lenses are designed to achieve high MTF values even at very high spatial frequencies, which is essential for capturing fine details on modern 4K, 6K, and 8K sensors.
- On-Axis vs. Off-Axis: MTF data is almost always measured at multiple positions across the image plane. This reveals crucial information.
- On-Axis (Center): Performance in the middle of the frame is almost always the strongest.
- Off-Axis (Edge/Corner): Performance near the corners of the frame usually degrades due to aberrations. Analyzing the edge performance is vital because many cheaper lenses may look “sharp enough” in the center but become unacceptably soft in the corners. ARRI focuses intensely on achieving excellent uniformity across the entire large-format image circle, which is where their engineering excellence truly shines.
Sagittal and Tangential Lines: Adding Another Dimension
To get an even more complete picture of lens performance, MTF is measured in two orientations, particularly away from the center of the frame:
- Sagittal (or Radial) Lines: Lines that radiate outwards from the center of the image (like spokes on a wheel).
- Tangential (or Meridional) Lines: Lines that are tangent to a circle centered on the optical axis.
A perfect lens would treat sagittal and tangential lines identically, and the S and T curves would overlap perfectly. However, many lenses show differences between these two orientations, a clear indication of aberrations like astigmatism or coma. This distinction is crucial for understanding how the lens will render textures, patterns, and even out-of-focus areas (bokeh). ARRI’s comprehensive MTF reports always include both S and T curves, allowing for a profound, dimensional analysis.
Questions & Answers
Q: Does a higher MTF score always mean a better lens? A: Technically, yes, as it indicates higher fidelity. However, some “character” lenses intentionally have lower MTF in certain areas to create a softer, more vintage aesthetic.
Q: Why does the MTF curve usually drop at the end? A: All lenses struggle with extremely fine detail due to the physics of light diffraction. The goal of ARRI engineering is to keep that curve as high and flat as possible for as long as possible.
Q: Can I see MTF charts for my own ARRI lenses? A: Yes, ARRI provides detailed data sheets for their Signature and Master series, which include MTF charts for various focal lengths and apertures.